Interactive basis plaything#
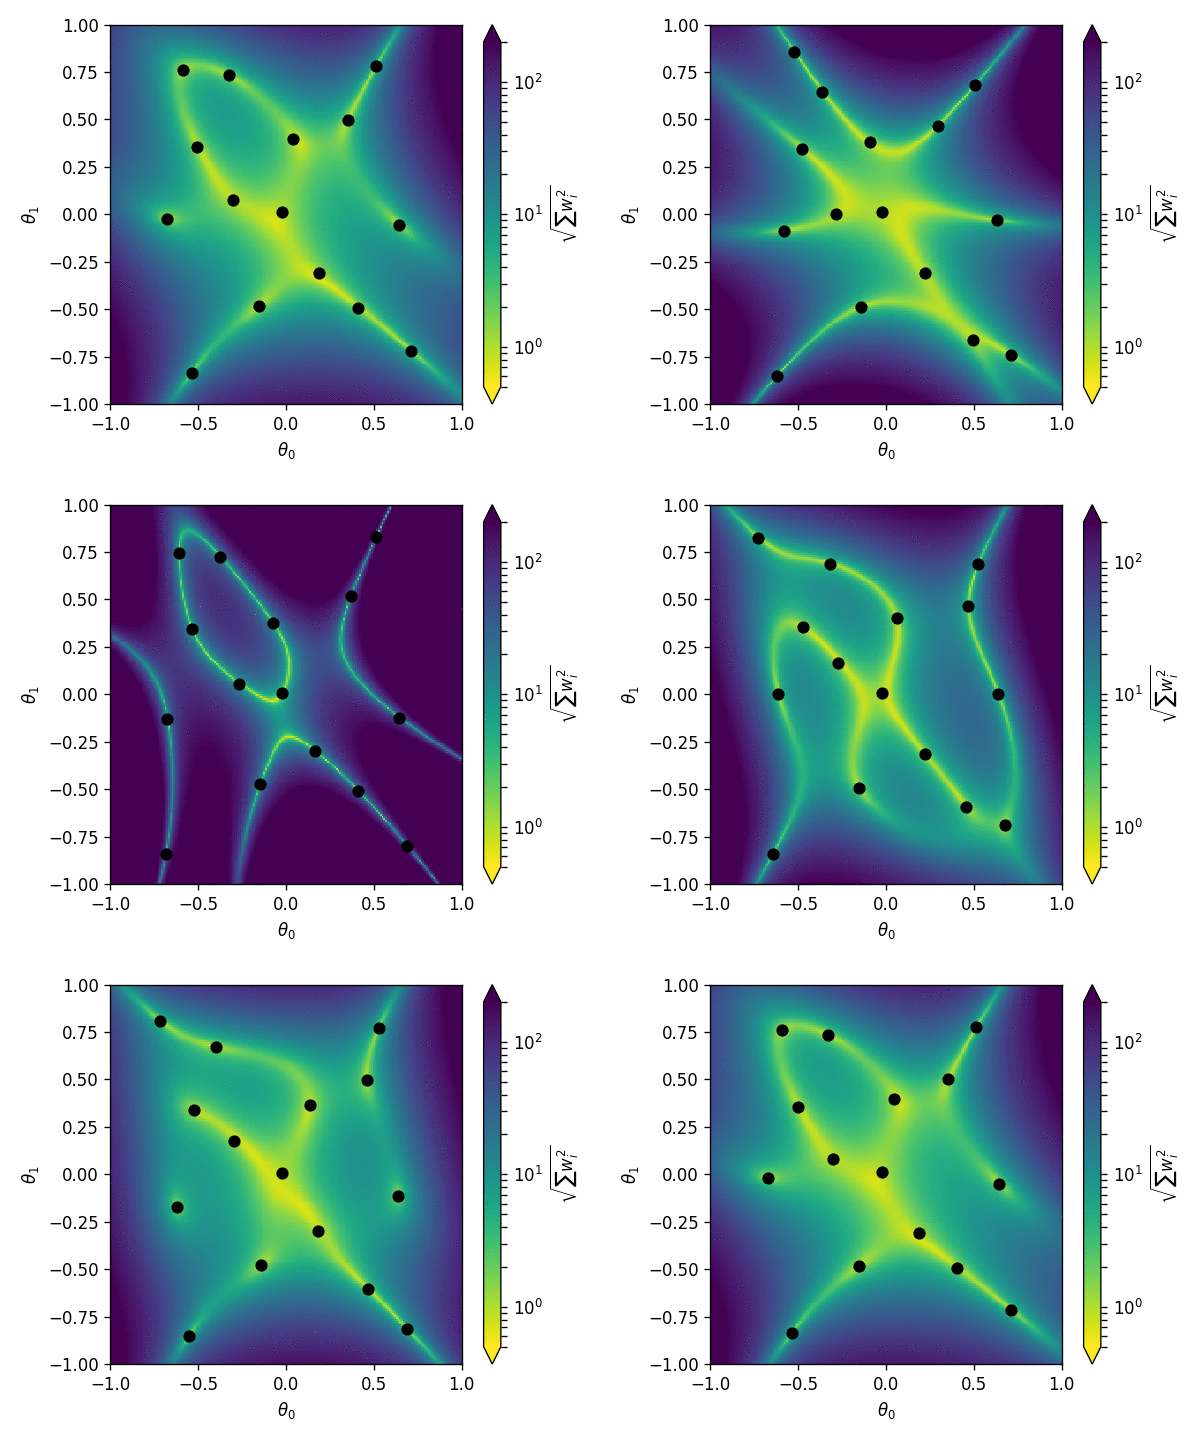
Allows you to interactively move the basis points (black dots) like in the animation below.

import numpy as np
import bqplot
from bqplot import pyplot as plt
from IPython.display import display
from ipywidgets import Layout
import numpy as np
import pandas as pd
%matplotlib notebook
import sys

try:
    from madminer.utils.morphing import PhysicsMorpher as Morpher
except ImportError:
    sys.path.append('../..')
    from madminer.utils.morphing import PhysicsMorpher as Morpher
Settings#
n_bases = 1
n_resolution = 50
Preparation#
morpher = Morpher(parameter_max_power=[4,4],
                  parameter_range=[(-1.,1.), (-1.,1.)])
_ = morpher.find_components(max_overall_power=4)
xi = np.linspace(-1.,1.,n_resolution)
yi = np.linspace(-1.,1.,n_resolution)
xx, yy = np.meshgrid(xi, yi)
xx = xx.reshape((-1,1))
yy = yy.reshape((-1,1))
theta_evaluation = np.hstack([xx, yy])

x_updated = False
y_updated = False
Basis evaluation#
def evaluate_basis(basis=None):

    # Optimization
    if basis is None:
        basis = morpher.optimize_basis()

    # Evaluate basis
    squared_weights = []

    for theta in theta_evaluation:
        wi = morpher.calculate_morphing_weights(theta, basis)
        squared_weights.append(np.sum(wi*wi)**0.5)

    squared_weights = np.array(squared_weights).reshape((n_resolution,n_resolution))

    return basis, squared_weights
Initial set up#
basis, squared_weights = evaluate_basis(None)
Interactive tool#
def update(change):
    global basis, squared_weights, x_updated, y_updated

    variable = change['name']
    values = change['new']

    if variable == 'x':
        basis[:,0] = values
        x_updated = True
    elif variable == 'y':
        basis[:,1] = values
        y_updated = True

    if x_updated and y_updated:
        basis, squared_weights = evaluate_basis(basis)
        heat.color = np.log(squared_weights) / np.log(10)

        x_updated = False
        y_updated = False
x_sc = bqplot.scales.LinearScale(min=-1., max=1.)
y_sc = bqplot.scales.LinearScale(min=-1., max=1.)
c_sc = bqplot.scales.ColorScale(min=0, max=1., scheme='YlOrRd')

heat = bqplot.GridHeatMap(color=np.log(squared_weights) / np.log(10),
                          scales={'row': x_sc, 'column': y_sc, 'color': c_sc},
                          row=yi,
                          column=xi,
                          stroke=None)

scatter = bqplot.Scatter(colors=['black']*len(basis[:,0]),
                         x=basis[:,0],
                         y=basis[:,1],
                         scales={'x': x_sc, 'y': y_sc})

ax_x = bqplot.Axis(scale=x_sc, label='fW')
ax_y = bqplot.Axis(scale=y_sc, orientation='vertical', label='fWW')
ax_c = bqplot.ColorAxis(scale=c_sc,
                        orientation='vertical',
                        side='right')

fig = bqplot.Figure(marks=[heat, scatter],
                    axes=[ax_x, ax_y, ax_c],
                    layout=Layout(width='600px', height='600px'))

display(fig)

scatter.observe(update, ['y','x'])
scatter.enable_move = True

